Project Management in Excel
Table of Contents
Why project management?
The curriculum at Iowa State University taught me a lot (statics, mechanics, thermodynamics, procrastination is a LOT harder in college…), but it didn’t teach me anything about project management. Why is that? I’ve had to use some form of project management in my daily professional life since day one.
I’m betting that project management is just one of those things that’s hard to put into a textbook. Because (at least in my experience) you only really learn project management when Plan A goes sideways. So you make Plan B… half of which goes sideways. So you make… You get it.
I’ve worked for three companies thus far in my career, but by-and-large most of that tenure has been spent with just one company: Viking Pump. Most people haven’t heard of them, though they’ve been in business since 1911, their products pump things you use everyday but never think about (toothpaste, asphalt, marshmallow fluff), and they’re one of very vew companies that can truthfully say they have products on all seven continents. Let that sink in for a moment.
As I’ve progressed in my career at Viking, I’ve taken on more responsibility with the overall ownership of a project. At first, I was just responsible for the CAD modeling and some calculations. Further on, I took on the development testing and validation stage for new products, under the leadership of a more senior engineer who was that project’s “project engineer”. Further on, I took on the total pump design, including the entire bill of materials, working with Supply Chain to get new parts quoted and ordered, and owning the total cost of the product. Finally, added onto this was the ownership of the whole process: everything above, but also planning out just who has to do what, when things need to be done, and when the concept has been fully tested and proved out, and is ready for production implementation.
That’s a lot to keep track of! And all this is done for each project, and typically each engineer handles a number of projects simultaneously.
Brain power: low-gear vs. high-gear
All these… “logistics”… are difficult for my brain to handle. My brain just isn’t as efficient at logistics as it is with details. Or in more mechanical, car-related terms, my brain is most efficient when it’s in gears 1 through 3. The low-speed, high-torque gears. Chugging away solving a technical problem with lots of little variables all at play, but somehow there’s a path forward if you just get some traction bit-by-bit.
Project management, on the other hand, is more like gears 3 through 5 (or 6, if you’ve got one of thoes fancy 6-speed transmissions). I see project management as the ability to get from here to there – that far-off, distant goal – and mapping out the quickest, most efficient route. You’ll need traction along the way, but gears 3 through 5-or-6 are all about speed and efficiency.
The difference between cars and people in this analogy is that people tend to be better at one or the other. My brain-engine is very efficient going from fully-stopped to rolling along at 45MPH in 3rd gear. But my brain-engine has a hard time transitioning into 4th and 5th gears to really get speed. If my brain is kept in these high gears for too long, like any mechanical device stuck in a low-efficiency state, it starts to overheat and not work as well.
So, I’ve had to lean on tools to help me do the job. The tool I needed was one that allowed me to keep track of both the little detailed things, and the larger logistic things, all in one place. And for me to be able to “see” things further out in the future, it had to be fairly visual. It seemed what I needed was a good ol’ Gantt chart.
Inspiration: Excel Gantt v 1.0
I didn’t make this from scratch; I actually found a much simpler version online when I’d searched for “Excel Gantt chart” or something similar. The original version was created by Glenna Shaw, but I can’t find the original version to display here.
Glenna’s version could track one project, with a place to input tasks and start/end dates, who the owner of that task was, and even information on how much they were paid by the hour. Then, as outputs, there was the Gantt chat and also a total project cost (“are we ahead or behind” kind of thing). It was pretty well laid-out, I have to say. It was a great place to start, but I needed more multi-purpose functionality. I didn’t want to have separate spreadsheets for each project. I wanted a one-stop-shop for everything that I was working on, whether it be a years-long platform project or a couple-days administrative task. Only when I could track everything from the big to the small, and have it all laid out in a timeline, could I use this tool to get better at thinking like a project manager. That was the key. “The hammer wields the hand,” if you will.
Oh yeah, I should also point out that this was done around the year 2015. Way before there were online SaaS tools to do all of this for you. Before there was Asana, Trello, or Monday.com. I’ve tried out a few of those, and I’ve been impressed by how well they work. But if (a) you don’t want to spend the money for the subscription service, or (b) you don’t trust having your data on a 3rd party server, you can rely on trusty ol’ Excel.
Excel Gantt 2.0: the “Project Master”
Below are a few screenshots showing the major functionality of the spreadsheet. I put a lot of “UX thinking” into the layout, where the main page is purely for visual data output and all other pages are for data input. An Excel version of “front-end vs. back-end”.
Project Timeline
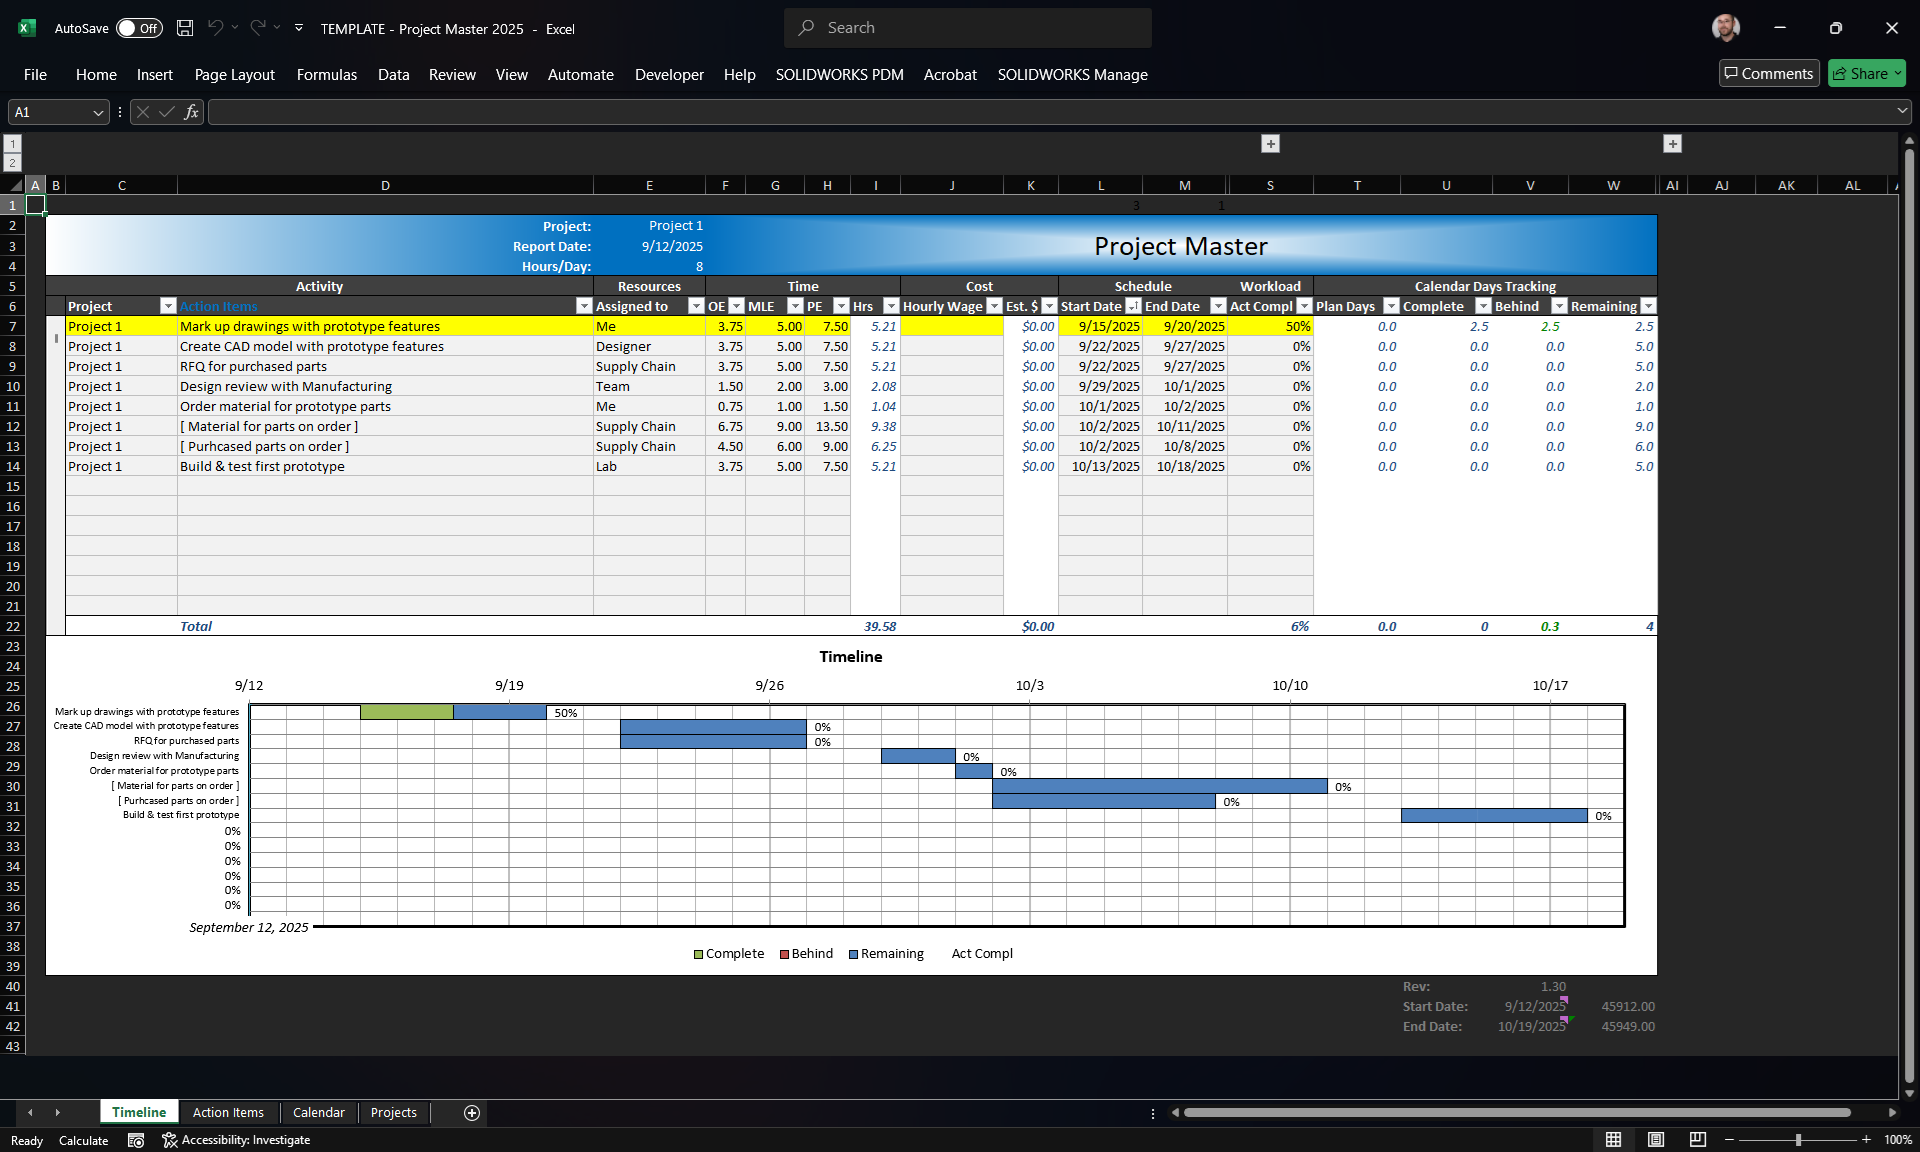
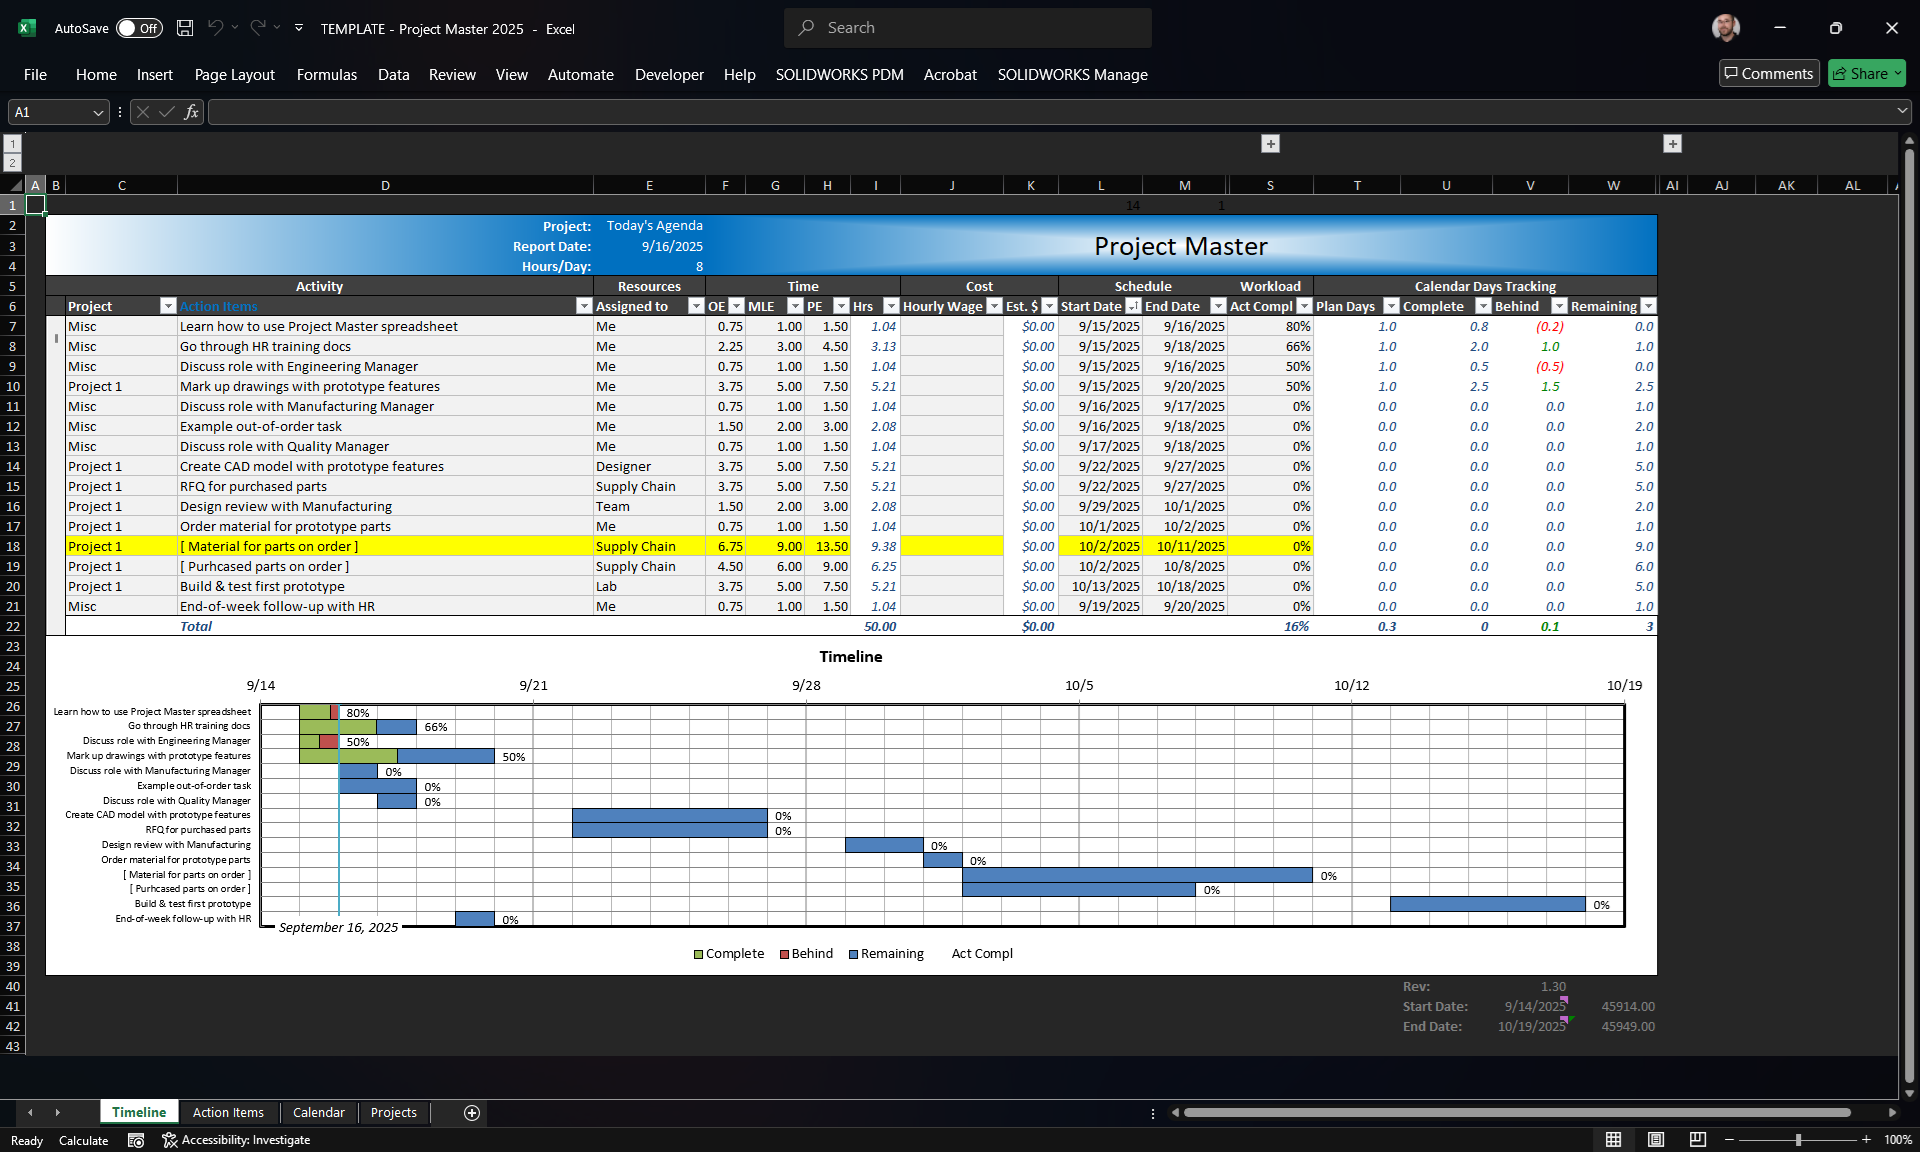
This is the main screen; a dashboard of sorts.
The top half is a list of the action items for the selected project, and the bottom half is that project’s Gantt chart. The sheet is called Timeline – because (a) it sounds better than Gantt, and (b) it allows me to think of every task, however small, as having its own time to completion – an important concept when you’re new to thinking this way.
In the blue header at top are the main controls for the Timeline. You’ll see this better in a screenshot below, but the cell that shows “Project 1” is a drop-down list. It lists all the different projects that you want to track. Once selected, both the list of action items and the Gantt chart below will update for tasks associated with that project.
Report Date and Hours/Day cells are actually hold-overs from Glenna’s version. I rarely change these, but they are referenced elsewhere, so I kept them in this version. The Hours/Day goes into the calculations about people’s pay and tracking overall progress, which you can see in columns J:W. Honestly, I haven’t needed to concern myself with paying other people, so I’ve left it alone.
The entire list of action items, in this case rows 7 through 22, are completely output-only. They’re there for you to view, and they populate the Gantt below. A few notes:
- Each column of the Action Items area is filter-able, so if you only want to see a certain department’s or person’s tasks, you can filter by that.
- It’s hard to see on the screenshot, but cell D6 has the word “Action Items” in blue – this is a link to the Action Items worksheet. It’s a small thing, but using this link requires less time moving the mouse vs. going down to the Action Items sheet at the bottom. Secondly, there are macros tied to clicking the Action Items link, so I highly recommend using it.
- Notice in column B that there’s a vertical scrollbar. Now, this used to be a standard scrollbar with arrows at the top and bottom, before some recent update to Excel. Since then, it’s a well-known bug that the arrows just disappeared. If you click the top and bottom areas of the scroll bar where the arrows should be, it works just like it should. So, if you have more than 15 action items for a given project, this scrollbar allows you to scroll through all of them and the Gantt chart will update.
- Lastly for now, you’ll see at the bottom-left of the Gantt chart that a date is displayed. What can’t be seen is a vertical line above that date, which is “today’s date” – it’s tied directly to the Report Date cell above. It just so happens in this screenshot that all the action items started at this date, with none starting beforehand. So, currently no tasks are behind schedule. Later, you’ll see this change. Also, the Gantt chart has VBA to ensure that full weeks are always shown and marked as such. This just makes it easier to quickly see from the chart how many weeks you’re looking at.
Okay, that’s most of how this page functions… with a little bit more I’ll follow-up on below.
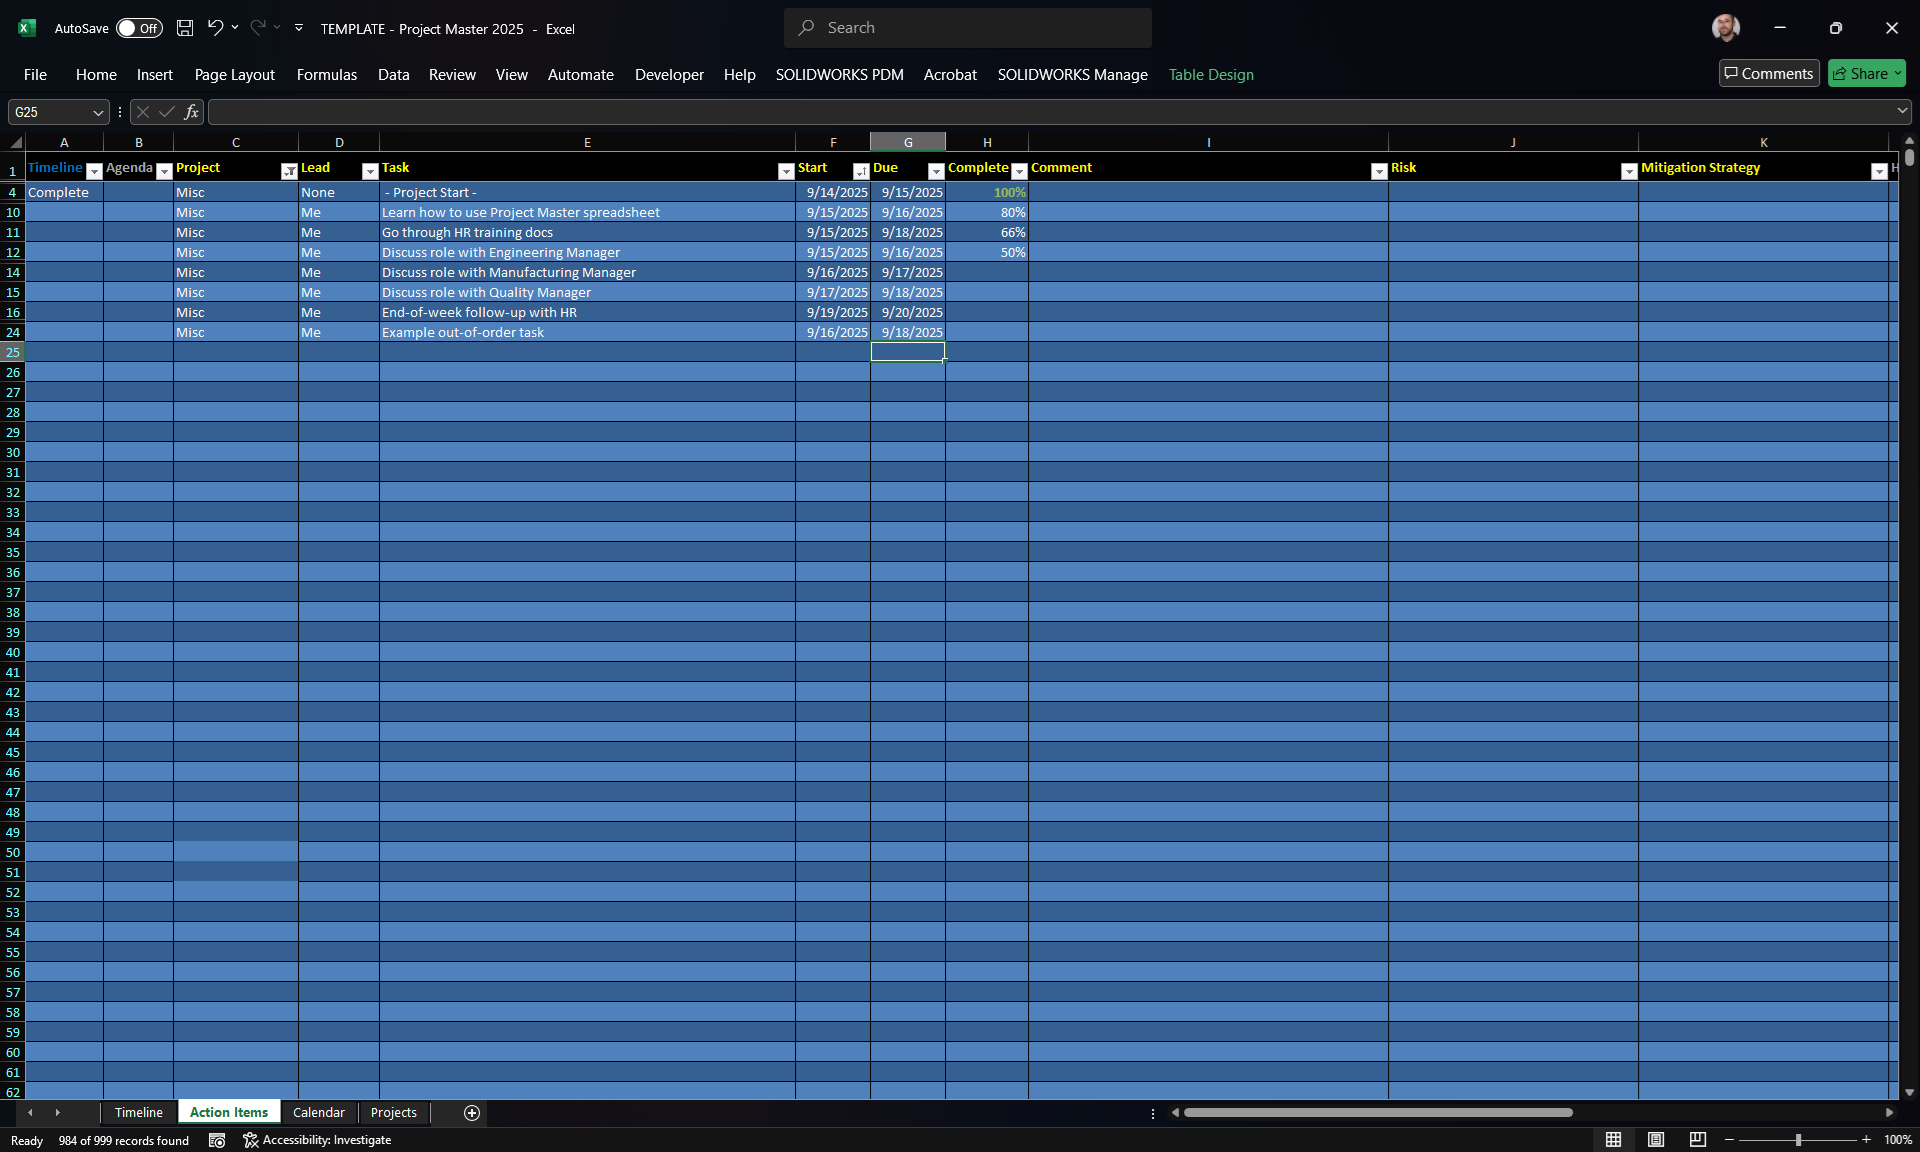
Action Items
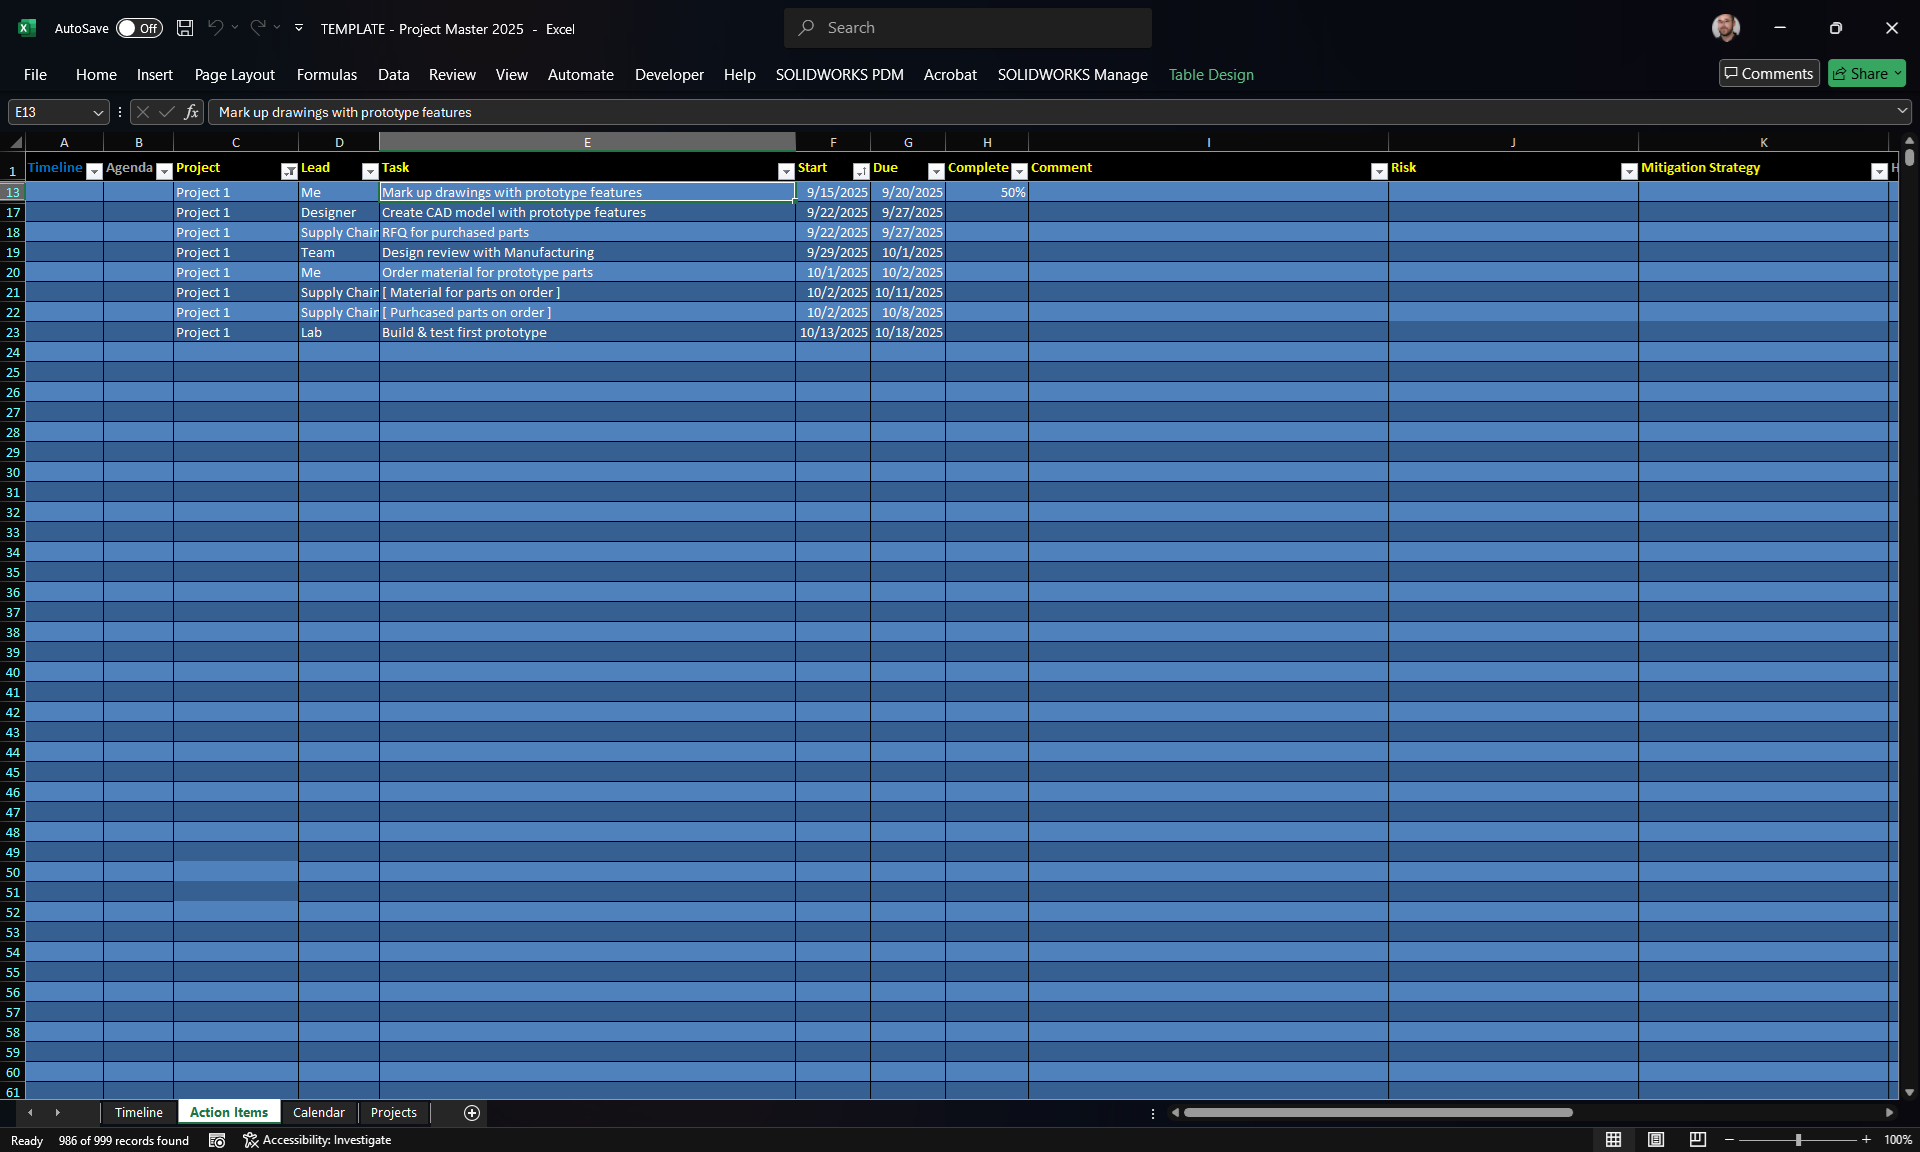
I know it looks weird, but it’s the best table color formatting to simulate a Dark Mode in Excel. If you know how to change a table color scheme, I won’t be offended if you feel the need to change it. With that out of the way…
Like I said, this is a table in Excel. This is the main input page. This is where you input any and all tasks for a certain project. Remember before how I highly recommended you use the “Action Items” link in the Timeline sheet? The macro I mentioned ensures that the Action Items sheet here auto-filters on the active project. It’s another small thing, but it saves a couple of clicks every time you go back and forth.
The main focus for this tutorial are columns C:I (or C:K if you really want to go crazy). The headers for these columns are in yellow to remind you of that. These are your input fields. Other cells are NOT input fields. In my spreadsheets I typically do a much better job color-coding obvious input fields from calculation or output fields, but for the sake of my poor eyes, this was the best I could come up with.
I think you can tell from the data I’ve inputted here, that everything is pretty self-explanatory. Since these tasks were just placeholders to get a pretty screenshot, I didn’t put any comments in. But I am a HUGE fan of comments. They’re my bread crumbs for remembering just what happened or who said what, tied to that task. And every comment cell is formatted for word wrapping, so you can comment to your heart’s content. Sometimes, especially for purchasing parts from vendors, I’ll have 4 or 5 lines of comments, all starting with the date that I got an update. For instance:
- 09/12 Sent email to supplier for quote
- 09/14 Received quote and submitted PO
- 09/15 Supplier acknowledges order, expected 10/15
See how all the tasks here are for the same project? That makes sense since Project 1 is the active project in the TImeline sheet. However, if you think of something that needs done for a different project, you can still just type it right here. If you add a task that’s not part of the active project, when you click the (again, hard to see here…) “Timeline” link, there’s another macro that filters through the Action Items, finding only those for the current project, sorting them all by start date, and then updating the Gantt. Pretty spiffy, huh?
Okay, now it’s time for the one skeleton in the closet. The one “gotcha” that you just have to get used to, because I didn’t want to make yet-another-macro to fix it. You see those dates in colulmns F and G? Well, the Start Date is just that; no issues there. Your project starts on the start date. However… for the sake of the Gantt chart, you want to make your End Date actually the day after you really want it to end. Why? Because the Gantt chart will cut off the progress bar at the beginning of the End Date. So a week-long project will start at the start of Monday and end at… drumroll… the start of Saturday! Get it?
Oh yeah. what you can’t see here is a few more columns to the right of K… and another table just like this one, only truncated and with a lot of formulas, to the right of that. These extra columns and extra table are the magic behind the Action Items sheet. They do a lot of sorting of all the action items, pruning only the ones that need displayed in the Gantt chart. They’re the workhorse of the entire Project Master, so it’s best just to leave them alone and forget they even exist.
To reiterate, once you’re done adding or updating Action Items, do your mouse and your wrist a favor and just go over to the “Timeline” link, and let the macros do their work. You’ll thank me.
Project Drop-down
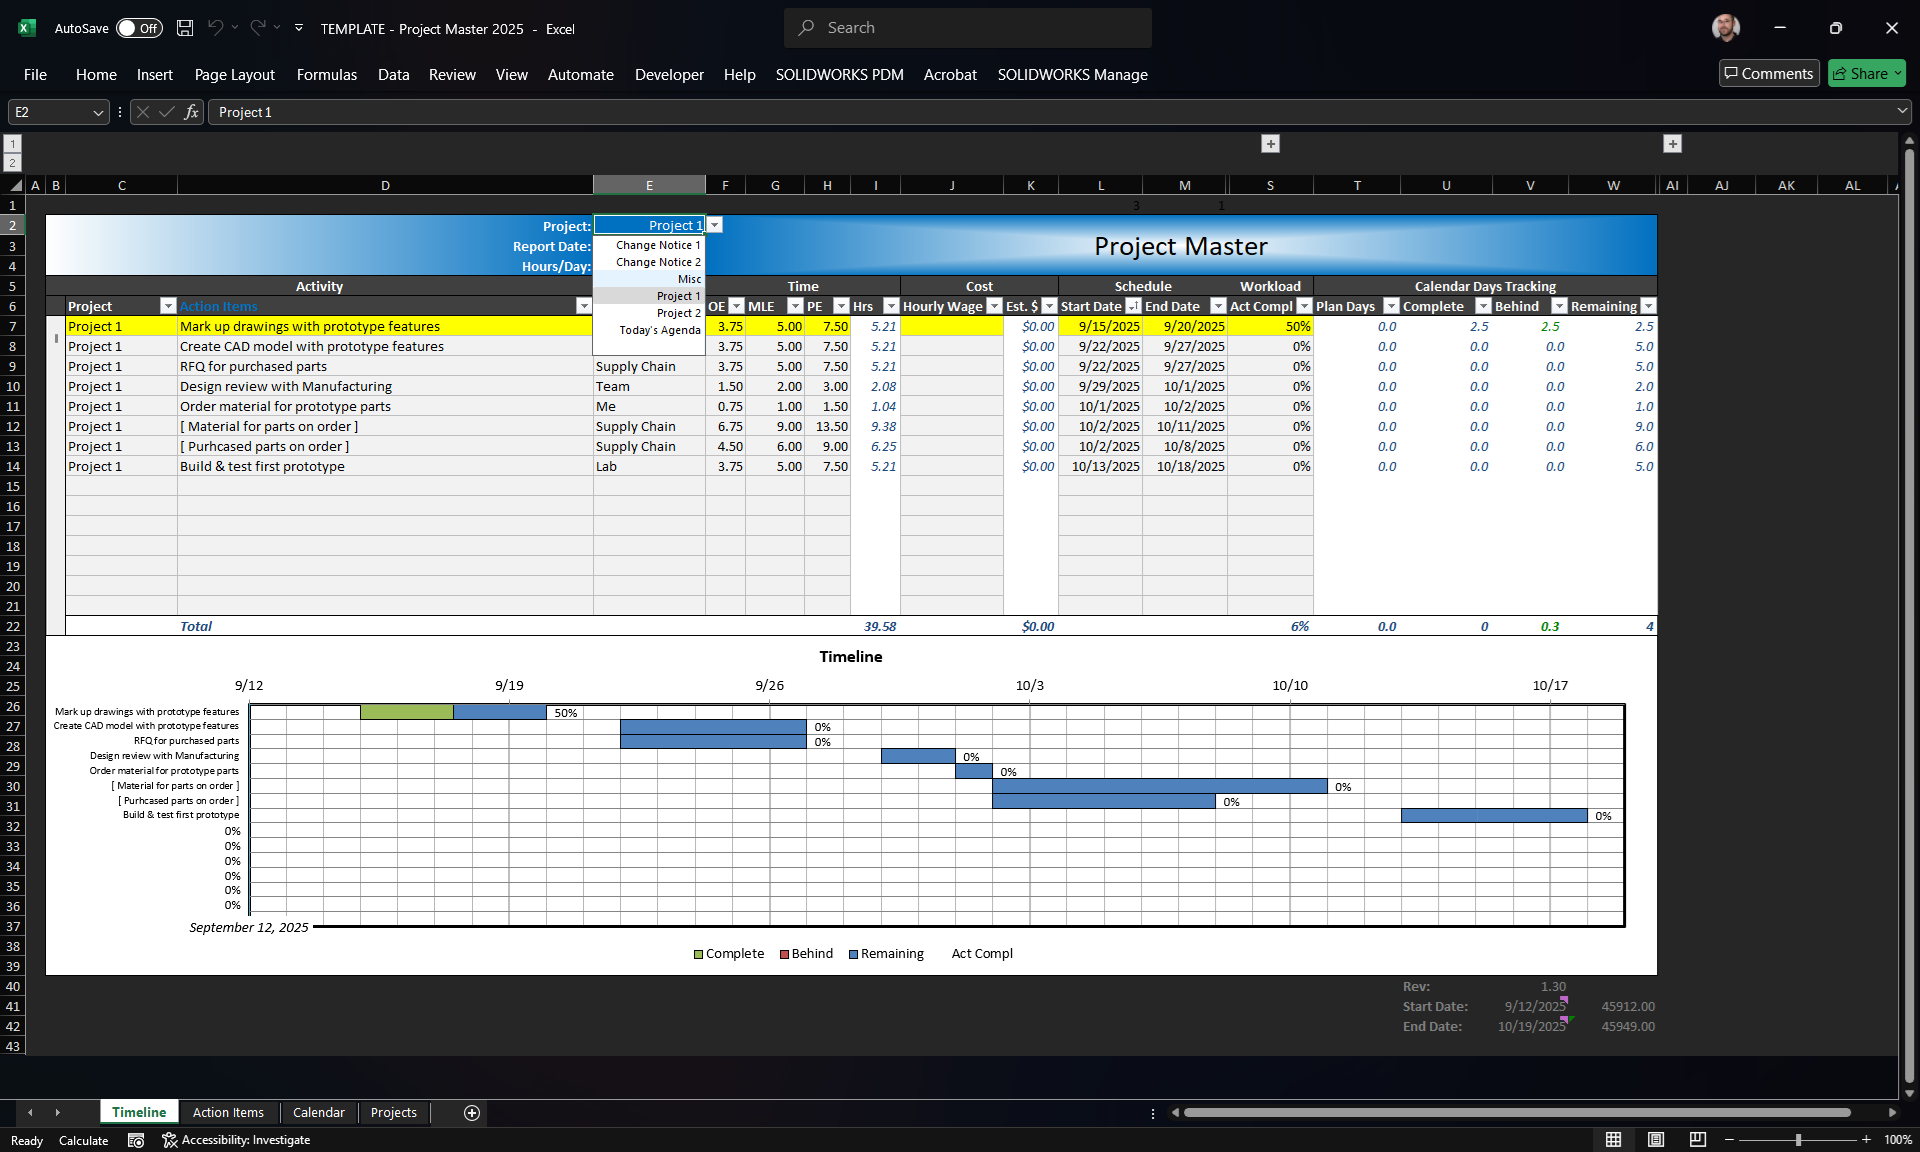
Back at the Timeline sheet, the macros enabled by clicking the link to the sheet have done their work, adding and rearranging tasks in the background. Both the Gantt chart at the bottom, and the list of action items for that project at the top, will auto-update.
The main focus of this screenshot is the Project drop-down. We’re currently displaying Project 1, but there are several others we can choose from. Clicking on any other project in the drop-down will auto-update the action item list and the Gantt chart.
For instance, if we go to the Miscellaneous category…
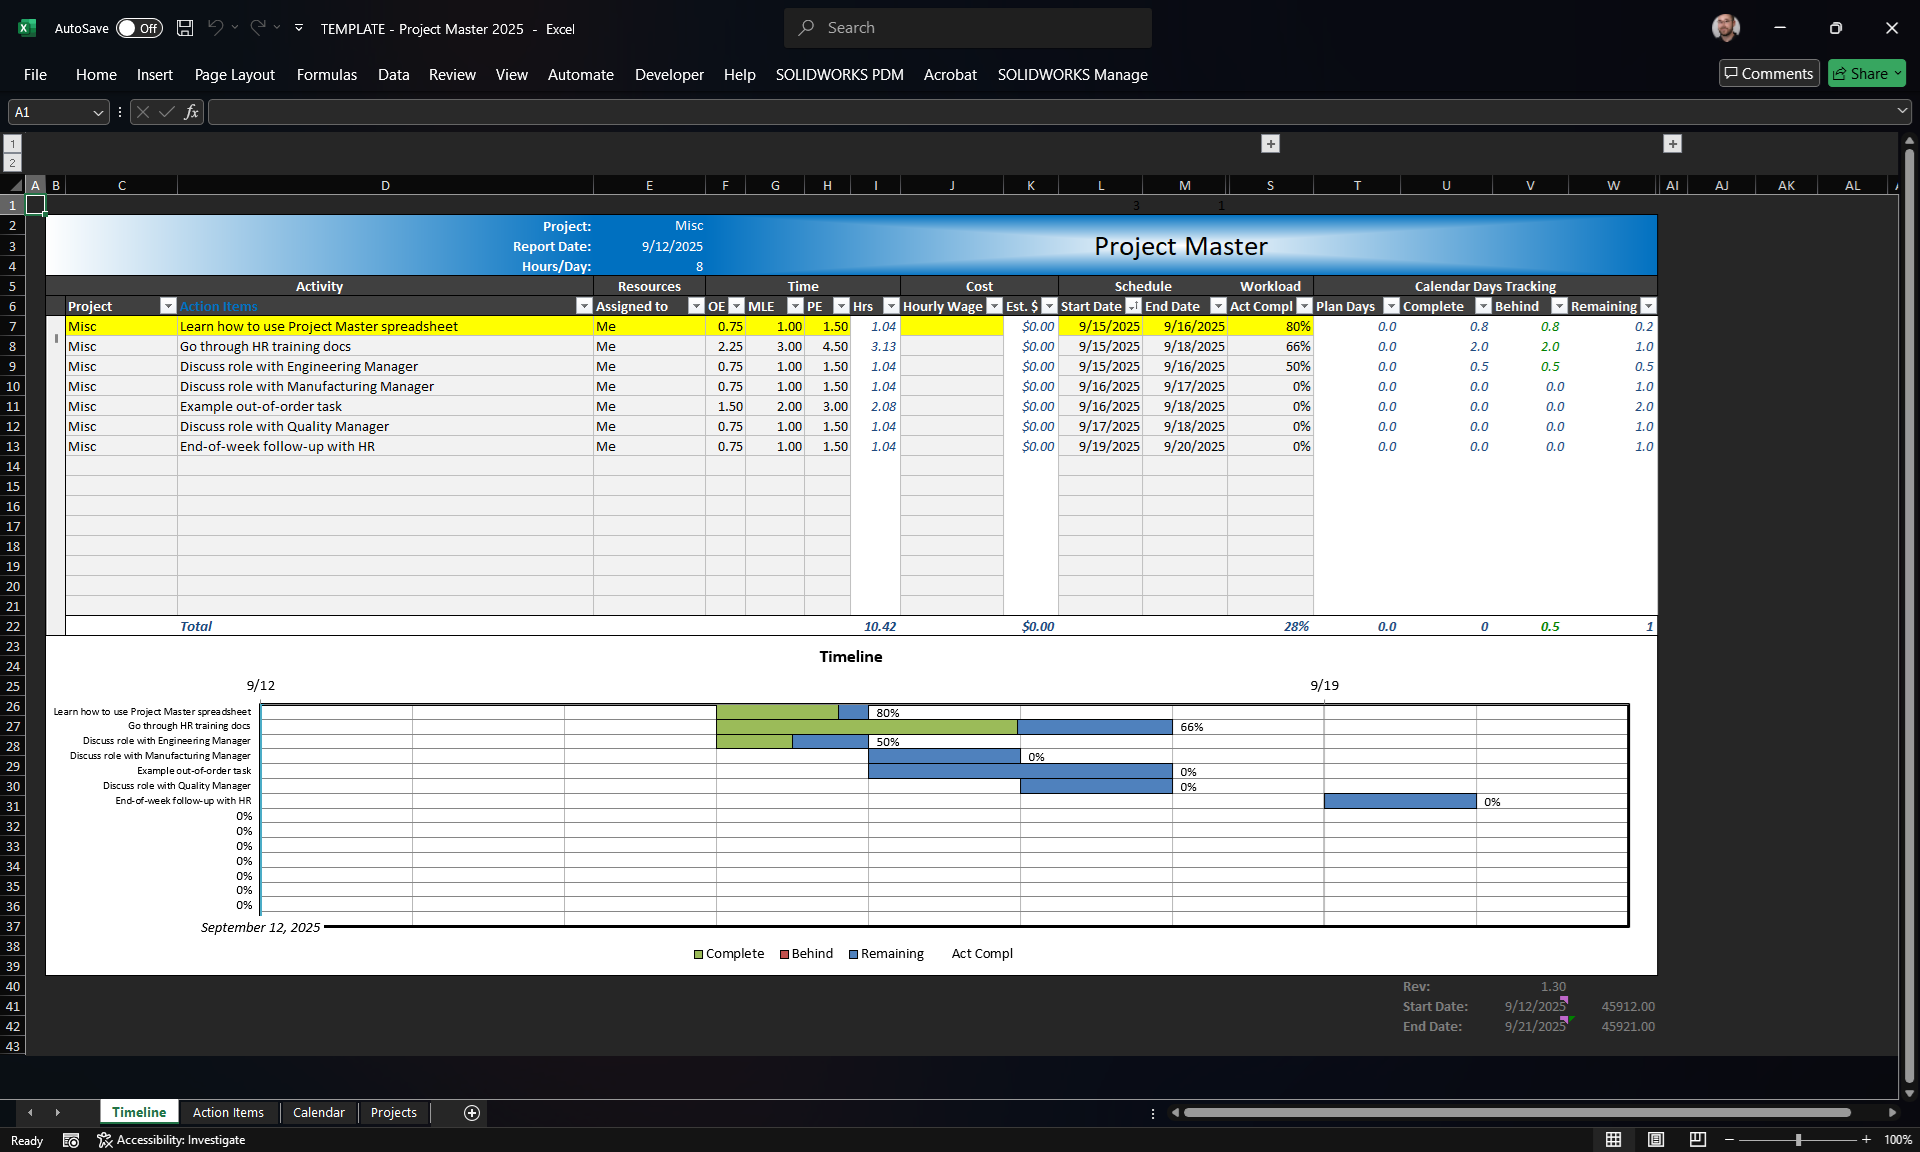
Miscellaneous Timeline
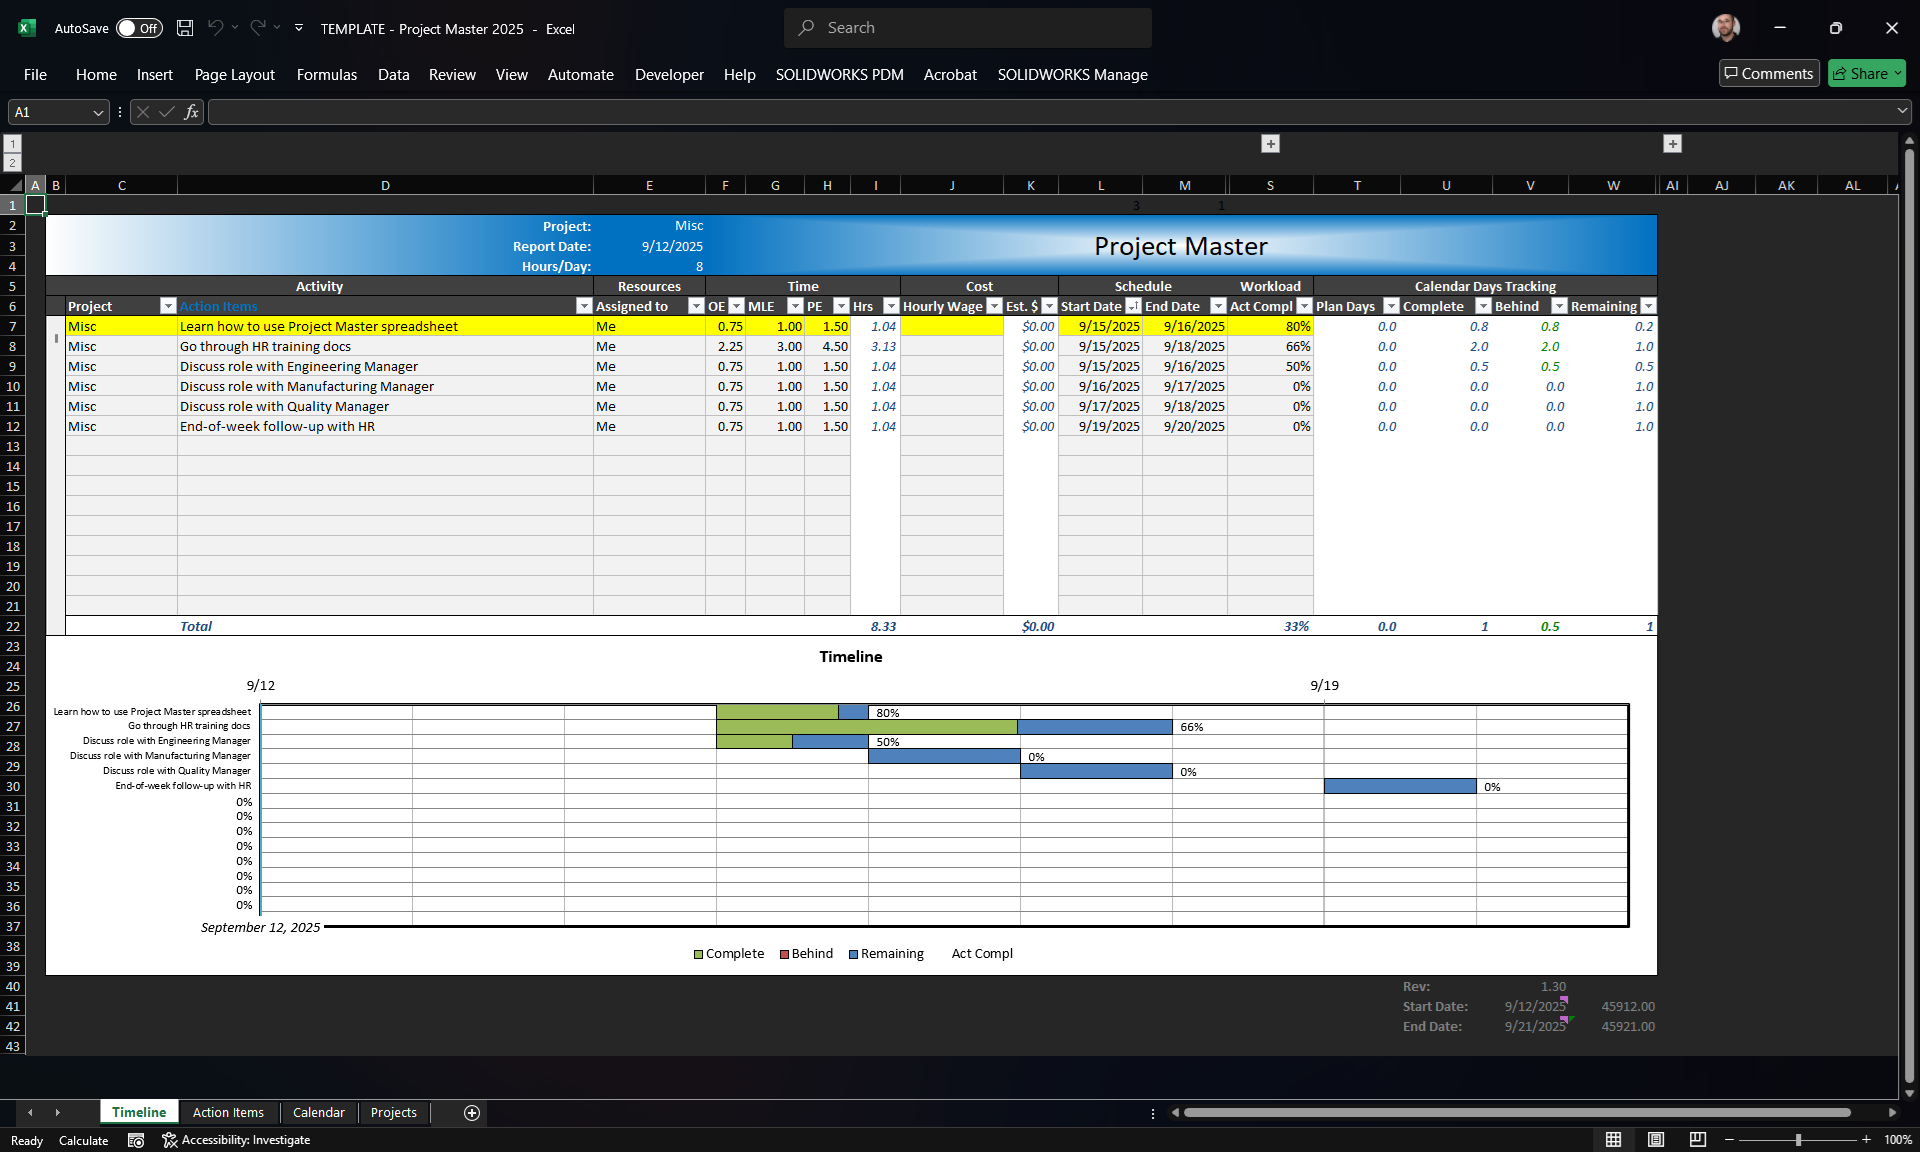
You can see that we already have a few things done or partially done.
What’s the first task that hasn’t been started yet? I’ll admit, it’s kind of hard to see from just the chart. To help focus on a certain task, there’s another simple macro to show here.
See that first line in the action items, the one that’s highlighted yellow? I want to see what the first task is that is yet-to-do. That’ll have a 0% completion in column S. If I click on that line with the first 0% Completion, that row will highlight. Then it’s much easier to look to the left to see what the actual task is.
You know what, I remembered there was something I needed to do, but I started it a few days ago… Let’s jump back to the Action Items sheet by clicking the link in cell D6.
Inputting Action Items
Okay, I’ve just added a task retrospectively. The task is “Example out-of-order task”, aptly named. See how its date is prior to some of the dates above? No worries. Simply click the link back to the Timeline sheet and the built-in macro will order it accordingly.
One other thing to note about dates. Like Peter Griffin, this one really grinds my gears. A previous version of this spreadsheet used the Microsofts DTPicker add-in, which made this sheet a lot easier. At the time, if I clicked on a cell in columns F or G, a pop-up window would display a calendar of the current month. I could click on the date I wanted for Start Date or End Date, and that cell would populate with that value.
Well, around the year 2020, Microsoft stopped supporting that. And so far, I have not found a decent replacement. I started to make my own, but I never got around to finishing it. It’s the next screenshot…
Calendar View & Date-Picker
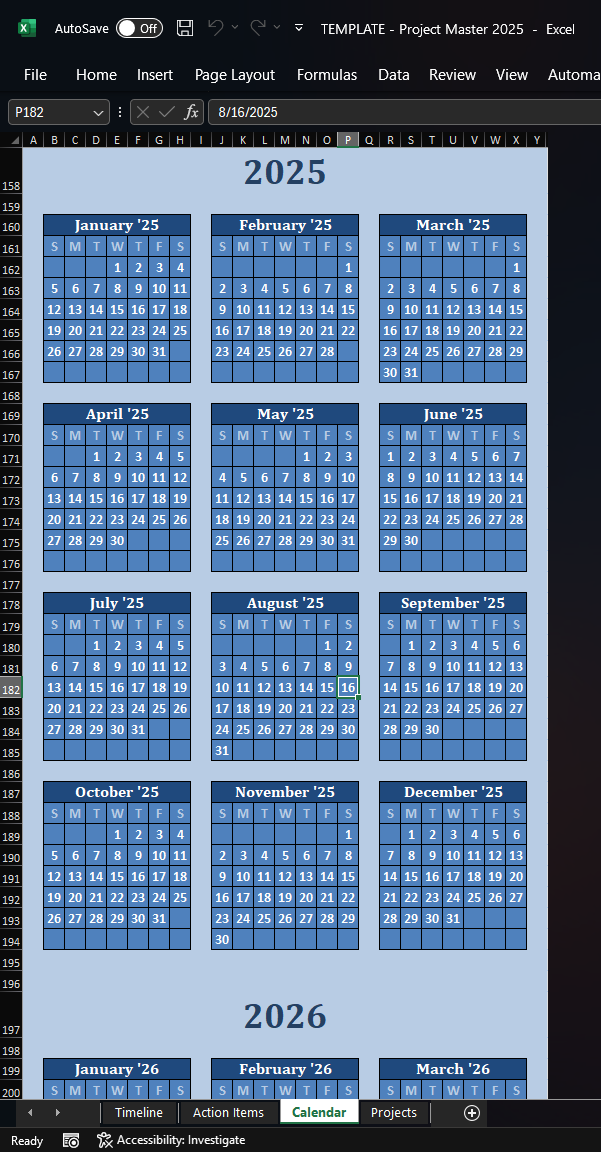
This is the Calendar sheet. Yep, it’s a calendar. Every day through the year 2030.
The macro I haven’t perfected yet will allow you to use this sheet as the new DTPicker to populate the date cells in the Action Items sheet. Some day…
Auto-Rebuilding of Timeline
Okay, back to the Timeline sheet. Now you can see row 11, where the “Example out-of-order task” now resides.
Today’s Agenda
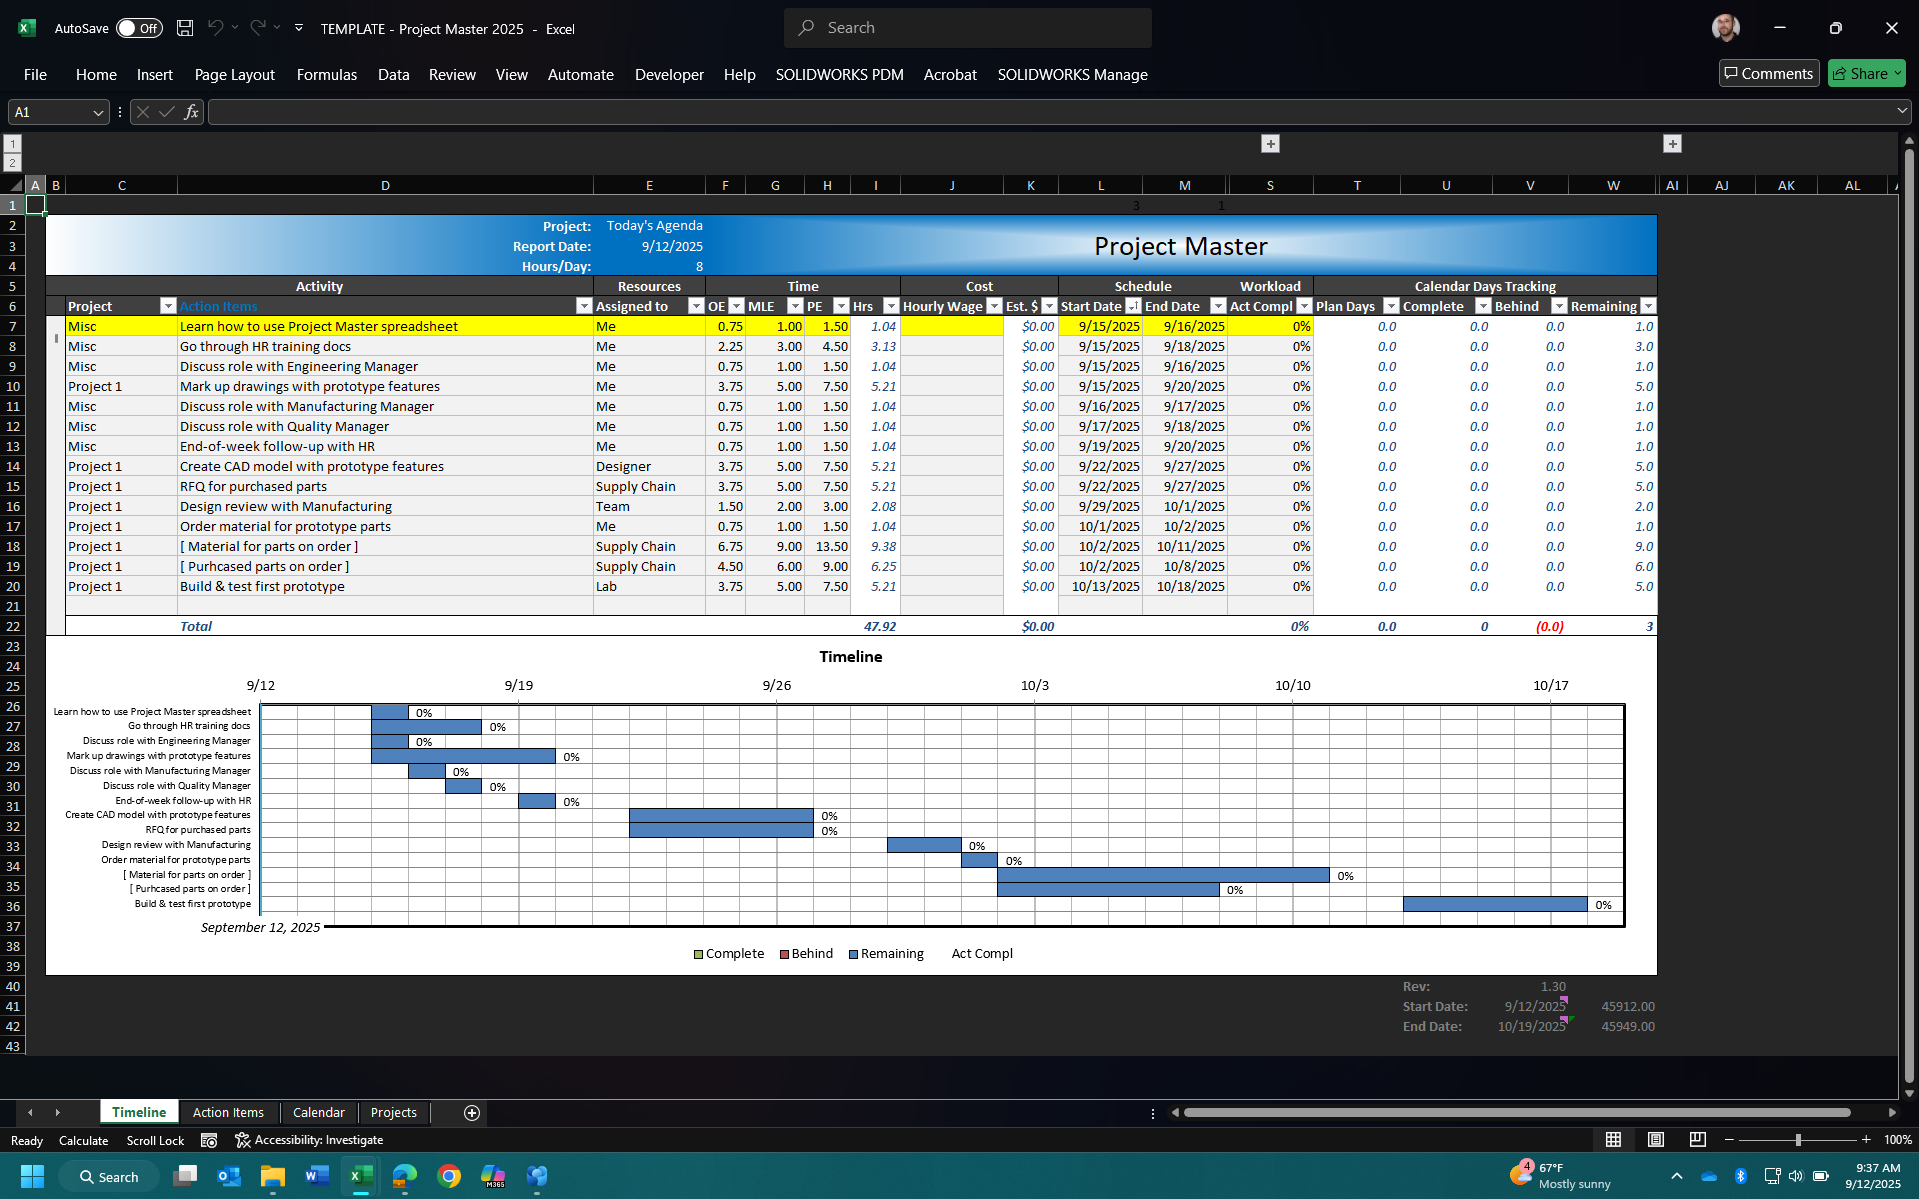
I’m almost done showing you all the bells and whistles. There’s just one other major feature that you need to know about: Today’s Agenda.
As you’ve seen thus far, I can track multiple projects of varying degrees of complexity, and have a Gantt chart for each of them. What if I just want to see, well… an agenda for today, comprised of all the projects?
Click that Project drop-down, select Today’s Agenda, and presto-change-o! All projects (I should say, open projects… you can close projects in another sheet) and their tasks are displayed. For the first time now, you can see what it looks like when something is behind schedule – that red portion of the first few tasks. I’d better get to those soon.
Forecasting, Task Selection, and Gantt Scrolling
So far, all these screenshots have shown you tasks and planning starting from “today”. I know what I need to do “today”, to forecast ahead. But what if I need to look a few weeks into the future and see what needs to be done by that date? Backcasting, if you will?
Easy enough. “Report Date” in cell E3 defaults to the formula “=today()”. So any time the spreadsheet is open, Excel pulls today’s date from Windows. But if you want to look ahead and see how things would appear some time in the future… just change that cell to that particular date.
Here I’ve hard-coded the date for September 16th, which is about a week from the time of this writing. Finally, in the Gantt chart, there’s a vertical blue line indicating the date. Now it’s easy to see what needs to have been done starting at that time.
If I had picked a date a bit further out, like say, 10/06… Currently, most of the tasks due for that date aren’t even started. So they would show red for “behind schedule”. If 10/06 is some kind of drop-dead date, then it’s easier to see exactly what needs done by then, or possibly that I need to shift priorities so that date is hit.
Also see how that one line is highlighted yellow. I don’t know why I chose that one; no particular reason. But I will just say that my personal syntax is to show a tasks that’s someone else’s responsibility, like suppliers… in square brackets. It’s just a handy visual to let me know it’s not my action to DO, but to follow-up on.
Also I don’t know why that very last task in the Gantt is out of order in the chart. Excel wouldn’t be Excel without being wonky.
Macros
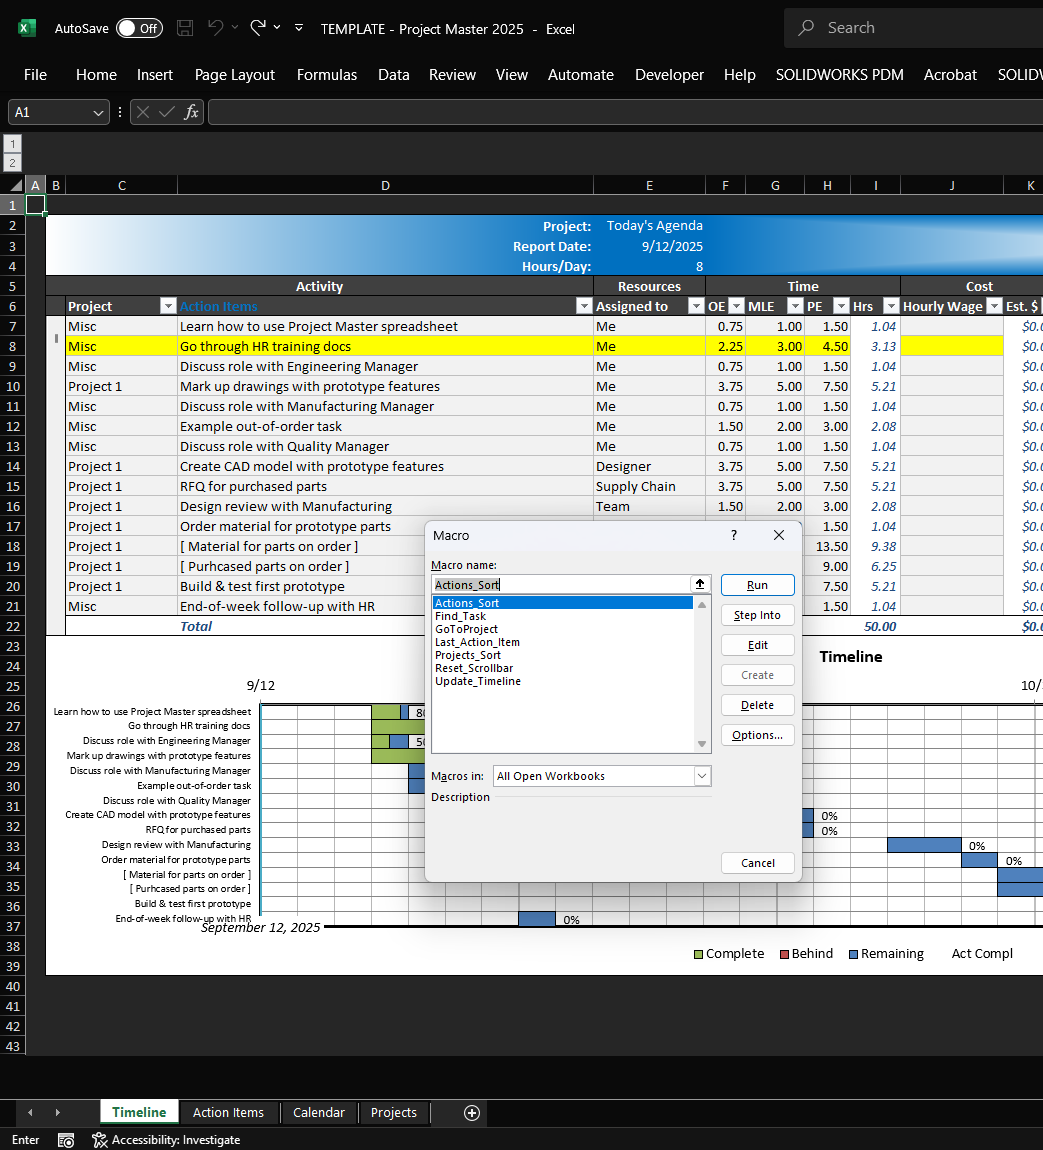
That’s pretty much it for this Project Master spreadsheet. If you want to take it for a spin yourself, I’ve put a copy here on GitHub. To reiterate one last time, it DOES include macros. But I can assure you they’re not malicious. The last screenshot is to show the macros mentioned.
What do you think? It’s obviously clunky by today’s online SAAS standards, but for being a child of the 2015 era, I think it does a decent job. But I’d love to hear what you think. Is there a different/better spreadsheet you use? Got suggestions for adding functionality or making things easier than they currently are? I’d love to get your feedback.